Analyzing Sales Data, in FMCG, for Business Growth
In the first article of the series, Vivek Bhatnagar wrote about the evolution of sales data and its collection in the FMCG industry. In this article, he writes about the need to analyze the sales data, make the right correlations and thereby the right decisions.
Ever wonder what to do with the mountains of sales data getting generated?
Lets start with an illustrative Business Problem
Shikha, the newly appointed analytics manager of Snowhite Dairy Products was sifting through the Sales Data for the last two years. In the monthly meeting (April of this year) earlier in the day, a lot of discussion had been on the plateauing sales of the star product of the company, the ice cream range. Snowhite was a late entrant in the category for the market but had captured 15% of the market share and was growing at over 30% for the previous two years. They were in April. The rate of growth this year had been clocking close to 25%. There was good demand for the flavors that Snowhite made and there were no product complaints either. What could be the the reason for slowing growth rate? Could the data tell her something?
Recap:
In part one of this series, we shared, how the FMCG sales companies are generating large quantum of data. I wrote about almost 700 million data points were generated annually by a company with 900 distributor salesmen. The simplistic calculation being, each salesman carries 90 SKU and makes 30 sales calls everyday and works 24 days in a month.
The standardised reports get generated using this data and get emailed to the sales hierarchy. Separately, some specific analysis for some specific Route/Product/salesperson gets done sporadically and conclusions get drawn
This yielded some inferences which were used by the Sales Officers to solve some localised problems. And the sales leaders used the analysis to ask the right questions from their subordinates and provide good data backed answers to their managers.
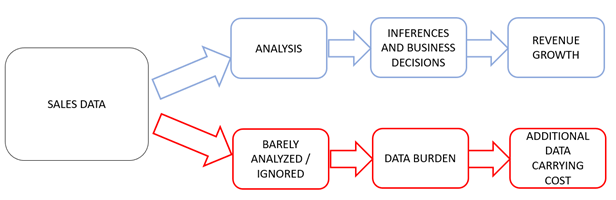
You see that while the data has changed in quantum to be classified as “Big Data” and has changed from from paper to digital, the analysis it is subjected has not kept pace. In fact, it has remained rudimentary. Almost as if it being in structured and digital form hasn’t been noticed at all; It is either lying ignored, or it is sitting like a “Data Burden”[1]
It is worth noting that while data generated in the sales process may look like a by-product of the order taking process, there is a cost, borne by the company, involved in generating it as well as in storing it; With no potential benefits being extracted.
Coming back to the problem that Snowhite is grappling with. Shikha checked if the icecream sales had any correlation with the flagship product: Milkshake. She found that sales correlation (R) was 0.86 across months if calculated across the country This meant that where Milkshakes did well, so did icecream. But, for states and territories the data was more spread out. While for most territories R >0.9, Mumbai, NCR and Chandigarh were around 0.65 (previous year was 0.88) thus impacting the national numbers. Shikha realised, to her surprise, that both Milkshakes and icecreams were growing, but at different rates.
3nayan experience says, above 50% of FMCG organizations believe that integrating demand signals from disparate systems is a major issue.
She showed the data to Jaspreet Singh, the Head of Sales, who looked at it and said that his hunch was that these areas did not have enough cold room capacity to stock ice cream. Thus Milkshakes continued to grow, while ice creams lagged. Shikha checked the frequency of ice cream orders in these areas and found that 59% of the distributors had ordered ice creams at double the frequency of that of the rest of the country. She even calculated the cold room capacity required using regression analysis. When Jaspreet asked the respective sales managers to check, his inference were proven correct.
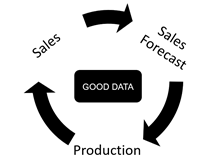
Allow me to now generalise this example. Clearly, a well developed, data led sales forecasting system leads to no loss in sales opportunity and fresh stocks on the shelves. This also leads to better production planning and reduction in unnecessary stock outs or stock pile ups. The impact is immediately seen as higher revenue and better working capital management.
One could perhaps use Average sales, Maximum and Minimum sales values and arrive at a forecast with rudimentary analysis. While these are better than not using data at all, they fall well short if the earlier mentioned 700 million data points were put through regression analysis to generate some closer predictions Now if data across multiple years were to be used, the accuracy of the predictions, of course, would increase.
Let me end this article by saying that Sales Data (like all data), by itself is actually quite inert and becomes a Data Burden if not used. On the other hand, when expertly analyzed, this delivers excellent insights leading to better decisions and revenue growth.
In my next article, we will talk about how companies could strengthen their analytical capabilities to match the quantum and quality of data.
[1] A term we use for a situation where some data is generated and lies dormant, people know it is there but nobody really owns it or does anything with it It sits weighing heavily on the mind but is busily swept under the carpet till someone senior makes a mention of it. But nothing gets done again.
Have you considered collating your sales data, and passing it through an analysis funnel yet? Would you like to know more? Visit the 3nayan web site or write to us.
Vivek Bhatnagar is an FMCG veteran in India, and is a partner at ZA Consulting which provides business consulting services India in areas of sales and distribution, new product launch and go-to market strategies. ZA Consulting is a 3nayan partner.