The Intercept Fallacy: Why Trajectory Trumps Milestones
Some of the recent transformation executions, using 3nayan designed strategy, seemed to falter at similar blind spots. When asked to revisit, we noticed that in the rush to deploy enterprise AI infrastructure, an execution failure we recently analyzed through the lens of how the “Liability Shield” is quietly driving compliant corporate failure , the execution teams were routinely measuring and celebrating the wrong achievements. This repetitive tendency to fixate on a static, temporally localized data point while ignoring the long-term compounding direction of the system is what we term as the Intercept Fallacy.
This type of transformation required leadership to choose between the illusion of immediate compliance or the chaotic, rewarding path of compounding trajectory. That is the operational reality that the organisation has to contend with.
1. The Mirage of the Go-Live Intercept
To understand how deeply the Intercept Fallacy distorts corporate decision-making, we must discern a single coordinate from a continuous trajectory.
An intercept is a static snapshot on a timeline, the exact moment a system goes live, a dashboard turns green, or a legacy consulting partner delivers a 90-day wrap-up deck. A slope, however, represents velocity, and it changes. It is the rate at which your proprietary data thrust is refining your workflows, compressing cycle times, and expanding your operating margins month over month.
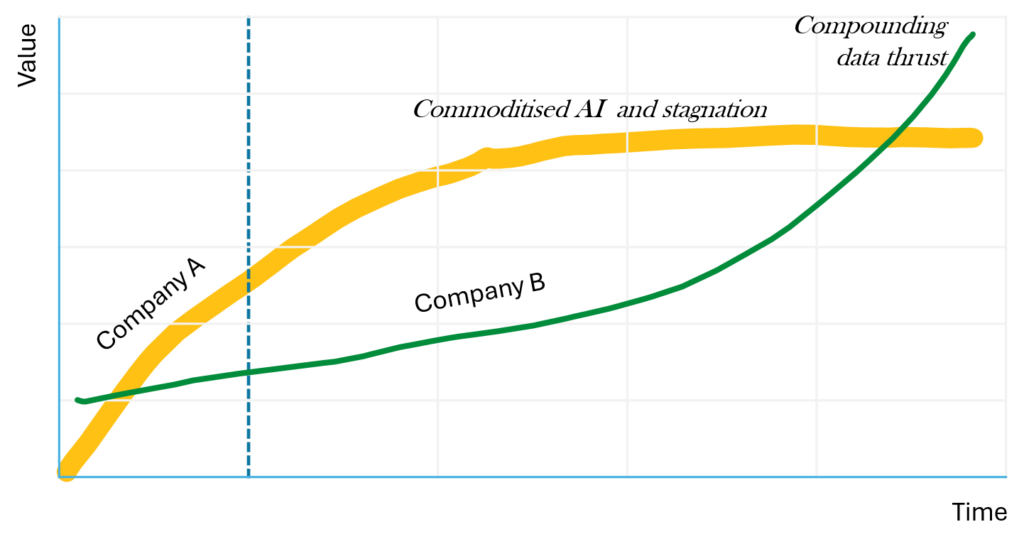
The above diagram shows an illustrative Company A building its roadmap around consensus API wrappers. On launch day, their intercept looks on the ball, matching their peers perfectly, checks every compliance box, and declares a localized victory. But because their system handles only sanitized data, their slope shortly, get flat.
Within 3-4 quarters, their expensive AI infrastructure becomes a commoditized utility, yielding zero structural advantage.
2. The Mechanics of the J-Curve Paradox
Escaping this commoditization loop requires surviving a predictable structural dip, the the J-Curve Paradox.
When an enterprise moves away from generic, outsourced software models and begins architecting unique, un-sanitized data pipelines, surface-level operational indicators do not immediately improve. Rather, they often drop. As the organization retrains its teams, restructures its workflows, and integrates complex internal exceptions, short-term utilization metrics fluctuate.
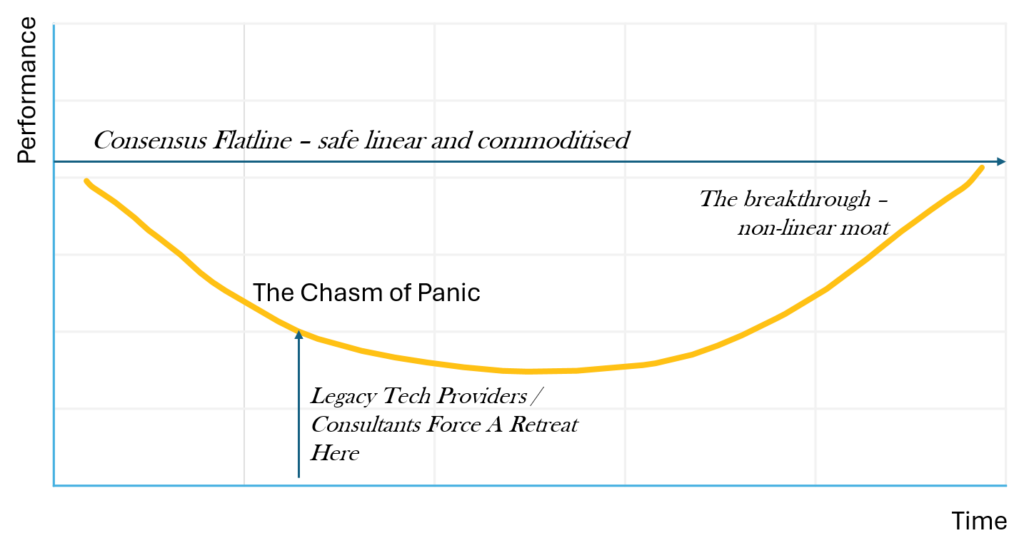
This temporary dip is why traditional tech services providers and legacy consulting firms fiercely reject a trajectory-based roadmap, because it is an immediate threat to their quarterly delivery SLA. They cannot easily bill for the messy, non-linear phase of custom data engineering.
So naturally, traditional service providers, to protect margins and ensure smooth project sign-offs, prioritise an easy intermediate intercept over a transformation slope to collect their implementation fees and exit before long-term stagnation becomes apparent. To do this, they deliberately push the enterprise towards the safe, flat line of generic consensus.
3. The Mathematics of Compounding Trajectory
To counter this structural resistance, leadership must transition to measuring the compounding acceleration of the entire architecture.
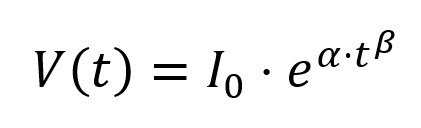
Bearing with the little bit of mathematics below, we define the divergence between a consensus-built system and a high-velocity, proprietary architecture through a non-linear trajectory model. Then, the total strategic value V(t) generated by an enterprise system over time t is represented by:
Where:
- I0 represents the initial intercept value (the baseline capability at go-live).
- e is the euler’s constant (~2.71828) used to represent continuous compounding
- α represents the systemic efficiency coefficient driven by un-sanitized, proprietary data inputs.
- β represents the structural velocity exponent(the rate at which workflow compression compounds).
When an organization optimizes purely for the initial launch (I0) using generic templates, α and β approach zero. The value remains completely flat, leaving the enterprise exposed to immediate commoditization.
True structural differentiation occurs exclusively when β tends to >1, meaning the system is designed to learn from every operational edge case, driving a non-linear divergence that competitors cannot easily copy.
4. The Three Gradients of Systemic Velocity
For transformation to impact, the Intercept Fallacy must be removed. That needs operationalizing this mathematical trajectory into a dynamic maturity curve. Leadership must actively force metrics to transition across three distinct gradients as the system matures:
| Gradient Horizon | Core Metric Focus | Structural Purpose |
| 1. Workflow Asset Turns | System Utilization & Adoption | Stabilizing the engine; ensuring the workforce is actively executing workflows through the new architecture. |
| 2. Margin-Volume Divergence | Revenue-to-Headcount Decoupling | Proving the economic engine; expanding transaction volume by 30-40% while operating costs remain flat. |
| 3. Workflow Cycle time Compression | End-to-End Systemic Speed | The ultimate velocity frontier; measuring how fast the entire enterprise can pivot and use new market stimulus. |
For this maturity model to work, the used metrics have a built-in expiration date. Once Gradient 1 becomes part of the daily routine, it must be retired. If an executive team spends its time reviewing the same utilization numbers for two consecutive years, then they are just measuring compliance, not competitive advantage.
5. The Strategic Imperative
If your strategic leadership reviews are dominated anything but analyzing the compounding slope of your operational trajectory, you are not managing risk.
Before deploying your next wave of capital into a consensus automation roadmap, ask yourself if the metrics are built to drive structural acceleration, or if they are simply designed to insulate your leadership team from the consequences of a slow corporate demise.
Up Next: Once you reject flat milestones and commit to the slope, how do you actually fund and defend this architectural transition? In our next post, we will look at The Decoupling Frontier: Breaking Free from the SaaS Tax and Reclaiming Sovereign Enterprise Value.
About The Author
